
Case Studies/Client Project
Digital Health / Clinical Research

LLM-Powered BI Dashboard for Clinical Trial Oversight in Mental Health Research

Real-time clinical trial insights for all stakeholders

Key Takeaways

Summary view generation dropped from 1–2 days to real-time — sponsors and ops teams query live data without waiting on the data team
Natural language to SQL — stakeholders ask questions like "Which site has the highest screen failure rate in women under 40?" and get instant answers
Amazon QuickSight dashboards cover enrollment status, demographic distributions, COA scores, and site-level drilldowns — all from a single PostgreSQL source
Non-technical teams access the same depth of insight as analysts, with no SQL knowledge required

The Challenge

The client runs mental health clinical trials across multiple sites in New York, generating fragmented operational data that only the data team could interpret. Sponsors and operations staff waited 1–2 days for summary reports, had no way to ask ad hoc questions, and were locked out of demographic and site-level analysis entirely.

Three specific gaps drove the engagement:

  • Reporting latency — manual aggregation and Excel-based reporting introduced a 1–2 day lag between data generation and decision-making
  • Stakeholder access — non-technical teams (sponsors, clinical ops) could not derive insights from existing dashboards; only the data team could query the data
  • Query rigidity — no mechanism to ask ad hoc questions such as "Which site has the highest screen failure rate among participants under 40?" — every question required a new dashboard build

Dishant has been instrumental in the development and scaling of our core technology platforms. His expertise has been pivotal in architecting robust backend systems and in streamlining the deployment of our machine learning and AI models, ensuring operational excellence. I confidently recommend him to any team seeking a talented and dependable technical partner.
Research Lead
Digital Health Research Company, New York

What We Built

Prodinit delivered a two-layer solution: an Amazon QuickSight interactive dashboard covering enrollment, demographic, and clinical outcome metrics, layered with an LLM-powered conversational interface that translates natural language questions into live PostgreSQL queries.
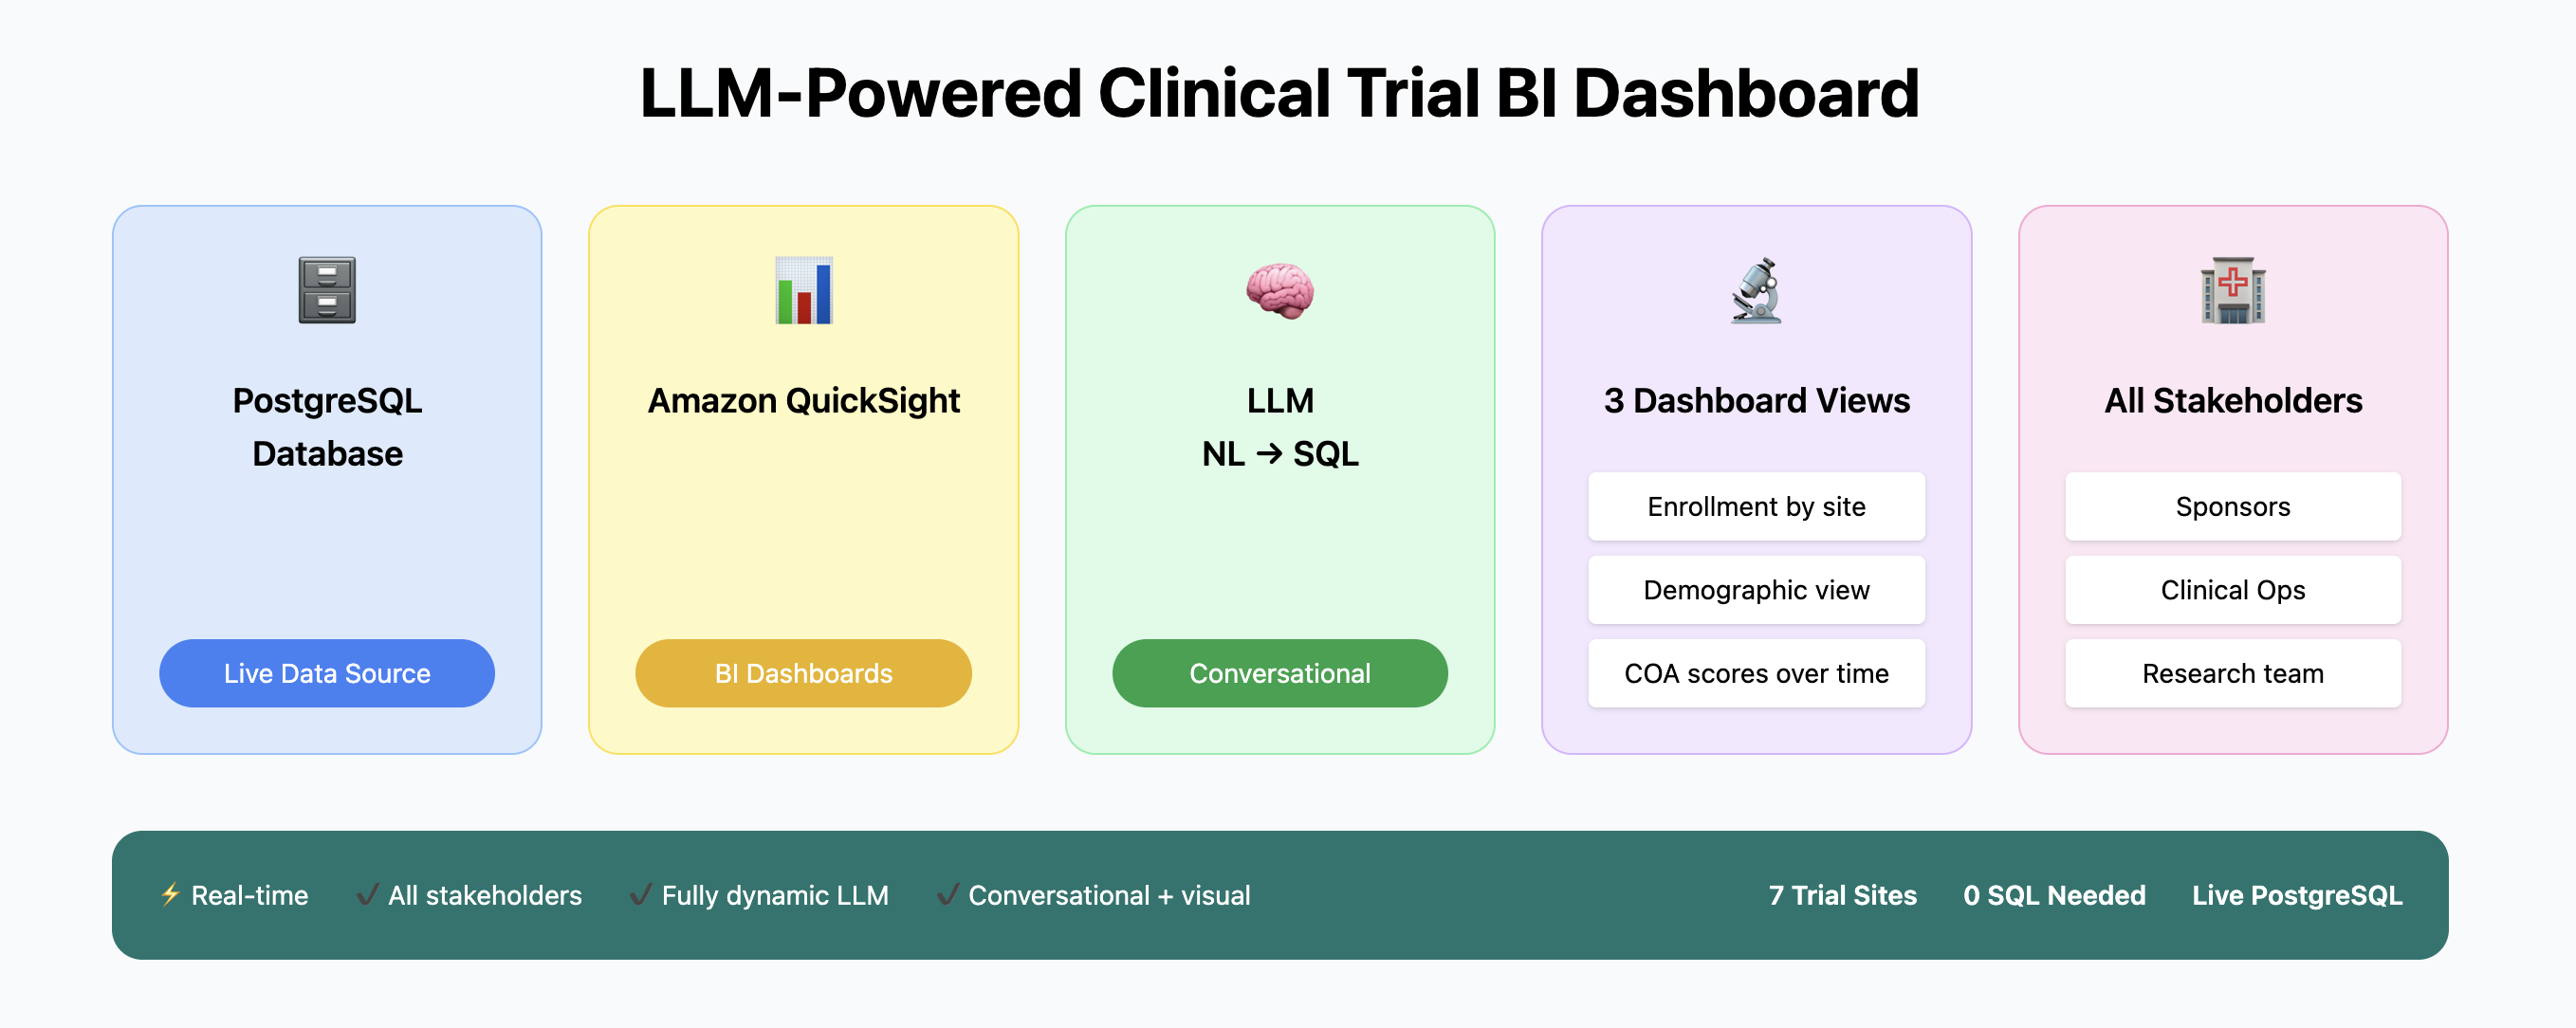
LLM-powered QuickSight dashboard: enrollment overview, demographic view, COA scores, and conversational NL-to-SQL interface

Amazon QuickSight Dashboards

Prodinit built three interconnected dashboard views, all fed from a live PostgreSQL database tracking clinical trial activity from February 2023 onwards:

Enrollment Overview — site-wise participant status across Completed, Enrolled, Early Terminated, and Screen Failed categories. A cumulative enrollment chart tracks progress over time across all active trial sites.

Demographic View — age distribution with statistical summaries (mean, median, standard deviation) per site. Gender distribution across sites including non-binary and undisclosed categories — a requirement for the client's mental health research reporting standards.

Clinical Measures (COA Scores) — Clinical Outcome Assessment score distributions over time, with Score 1 and Score 2 breakdowns by site. Notes, secondary reviews, and NMSSdev tracking all visible in a single view.

Drilldowns — cross-filters by site, participant status, and enrollment date range apply across all views simultaneously. Sponsors can isolate a single site's demographic profile without any data team involvement.

LLM Integration for Conversational Queries

The second layer gives every stakeholder — regardless of technical background — the ability to ask questions against live trial data in plain English.

Users type natural language questions; the system translates them into optimised SQL queries against the PostgreSQL database and returns structured answers or summary tables. No dashboard navigation, no SQL knowledge, no data team dependency.

Sample queries the system handles:

QuestionResponse
Which site enrolled the most participants in June 2023?Site 02 enrolled 18 participants in June 2023
Show average age of enrolled participants per siteTable with site-wise age averages
Gender breakdown of screen failures at Site 03?3 female, 1 male, 1 undisclosed

The LLM layer is connected directly to the same PostgreSQL database powering QuickSight — so conversational answers and dashboard visuals always reflect the same underlying data.


Results

Prodinit delivered the dashboard and LLM integration with stakeholder access live from day one. The client's sponsors, clinical ops, and research team now query trial data directly — without waiting on the data team or learning SQL.

  • Real-time summary views — insight generation dropped from 1–2 days to immediate, across all active trial sites
  • All stakeholders access data — sponsors, operations, and clinical teams query the same live PostgreSQL source; no longer restricted to the data team
  • Fully dynamic demographic drilldowns — age, gender, and site-level filters that were previously impossible are now a single click or a natural language question
  • Conversational + visual querying — natural language questions return instant answers; pre-built chart limitations no longer constrain analysis
  • 7 active trial sites tracked in real-time — enrollment, screen failure, completion, and early termination status all visible simultaneously
  • COA score tracking operational — clinical outcome assessment distributions by site and over time, previously unavailable to non-analyst staff

Frequently Asked Questions

Stakeholders type a plain-English question — for example, "Which site has the highest screen failure rate among participants under 40?" The LLM translates this into an optimised SQL query against the PostgreSQL database, executes it live, and returns a structured answer. No SQL knowledge is required. The translation layer is trained on the clinical trial schema so it handles domain-specific terminology correctly.
QuickSight integrates natively with PostgreSQL via a live connection and supports the multi-site filtering and demographic breakdown views the client needed. For a healthcare research context, keeping data within the AWS ecosystem also simplifies compliance with data residency requirements. The embedded dashboard model allows stakeholders to access views from within existing internal tools without a separate login or BI licence.
Both the QuickSight dashboards and the LLM query layer connect to the same live PostgreSQL database. There is no ETL lag, data duplication, or separate analytics store — a dashboard metric and a conversational answer to the same question will always reflect identical underlying data.
The enrollment overview tracks participant status per site across four categories: Completed, Enrolled, Early Terminated, and Screen Failed. A cumulative time-series view shows overall trial progress from the start of data collection. All views support filtering by site, participant status, and enrollment date range simultaneously.
Yes. The interface is a plain text input — users type a question as they would ask it verbally. The system handles query translation, SQL execution, and result formatting. In testing, clinical staff with no SQL background were able to retrieve site-specific demographic breakdowns and enrollment comparisons without any guidance beyond a brief product walkthrough.

Building in Digital Health?

Prodinit is an AI engineering partner for startups and enterprises. We build production systems that hold up cloud infrastructure, AI products, and data pipelines. No pitch, just an honest conversation.

Book a scoping call →